Work Breakdown Structure - (WBS) A division of a project into tasks and subtasks. The tasks are numbered to indicate their relationship to each other. WBSs are indispensable for project planning, particularly when estimating time and resource requirements. Some industries use established work breakdown structure systems for billing and reporting purposes.
Gantt chart is a graphical representation of the duration of tasks against the progression of time. A Gantt chart is a useful tool for planning and scheduling projects. A Gantt chart is helpful when monitoring a project's progress.
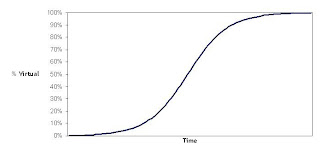
S-Curve A type of curve which shows the growth of a variable in terms of another variable, often expressed as units of time. For example, an S-curve of the growth of company sales for a new product would show a rapid, exponential increase in sales for a period time, followed by a tapering or leveling off. The tapering occurs when the population of new customers declines. At this point growth is slow or negligible, and is sustained by existing customers who continue to buy the product.
Pert (CPM)
Complex projects require a series of activities, some of which must be performed sequentially and others that can be performed in parallel with other activities. This collection of series and parallel tasks can be modeled as a network.
In 1957 the Critical Path Method (CPM) was developed as a network model for project management. CPM is a deterministic method that uses a fixed time estimate for each activity. While CPM is easy to understand and use, it does not consider the time variations that can have a great impact on the completion time of a complex project.
The Program Evaluation and Review Technique (PERT) is a network model that allows for randomness in activity completion times. PERT was developed in the late 1950's for the U.S. Navy's Polaris project having thousands of contractors. It has the potential to reduce both the time and cost required to complete a project.


